Introduction
TimeTrak Report Writer is a fantastic tool for creating custom reports and forms to display in TimeTrak Professional and TimeTrak Mobile.
The TimeTrak Report Writer uses Dev Express and the coding behind the scenes to interact with TimeTrak is Visual Basic.
It is recommended that users are familiar with SQL, the MYOB Exo and TimeTrak databases and Dev Express Report Writing, before creating or editing reports within the TimeTrak Report Writer.
Resources
Below is a list of websites that the Exosoft Team utilise when creating TimeTrak Reports (2018)
DevExpress Reporting: https://documentation.devexpress.com/XtraReports/2162/Reporting
DevExpress Report Demos: https://www.devexpress.com/subscriptions/reporting/demos.xml
DevExpress Creating Reports in Code: https://documentation.devexpress.com/XtraReports/115726/Creating-Reports-in-Visual-Studio/Detailed-Guide-to-DevExpress-Reporting/Reporting-API/Creating-Reports-in-Code
Visual Basic Guide: https://docs.microsoft.com/en-us/dotnet/visual-basic/
Accessing the Report Writer
The Report Writer can be installed as its own piece of Software onto a PC or server.
Please ask your Exosoft Consultant to do this for you.
Otherwise, the Report Writer can be opened from within the TimeTrak Admin Console.
Log into the TimeTrak Admin Console.
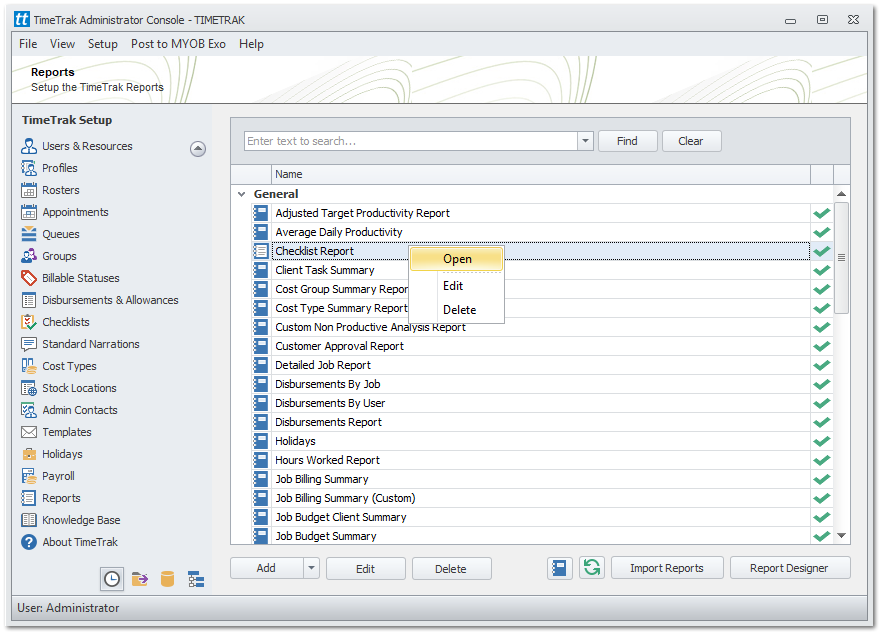
To edit an existing custom report, right click on it and choose Open.
This will open the report within the Designer.
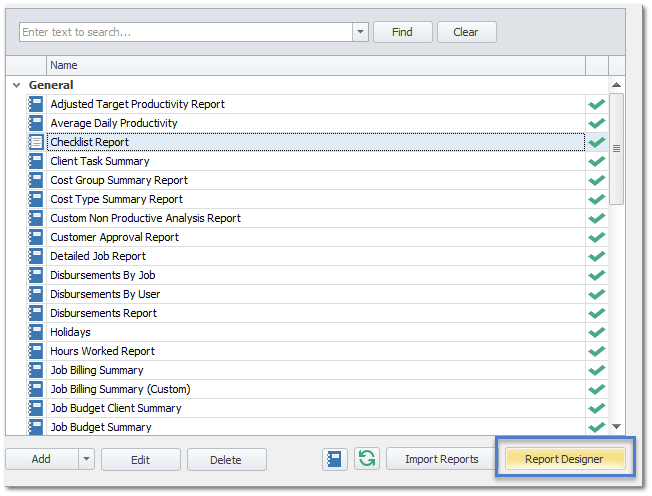
The other option is to click on the Report Designer button to open the Designer without a preloaded report.
Create a New Report
The Report Designer is already set up to pull in two data connections.
One to the MYOB Exo database and one to the TimeTrak database. These do not have to be set up by the user.
Click on the New Report Icon (not the drop down option)

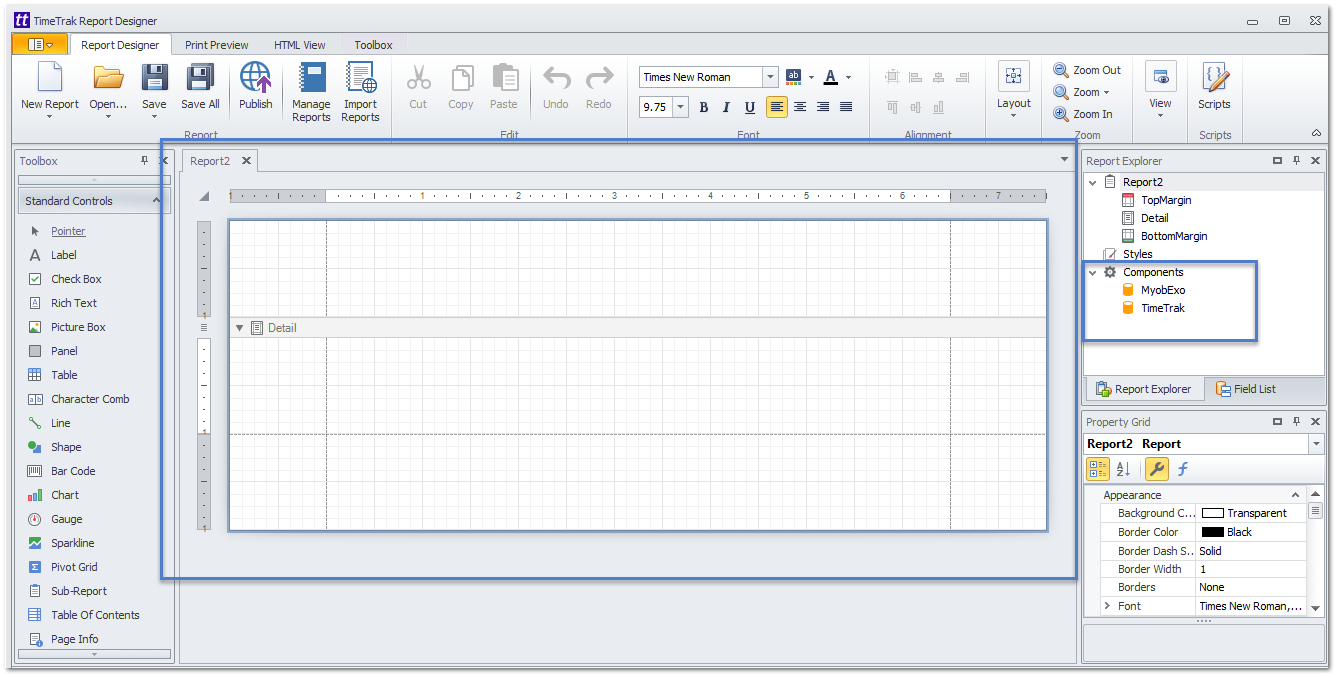
The New Report will load onto the main panel
Notice that the Data components have already loaded, one for MyobExo and one for TimeTrak.
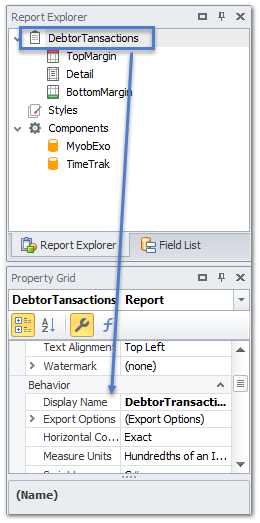
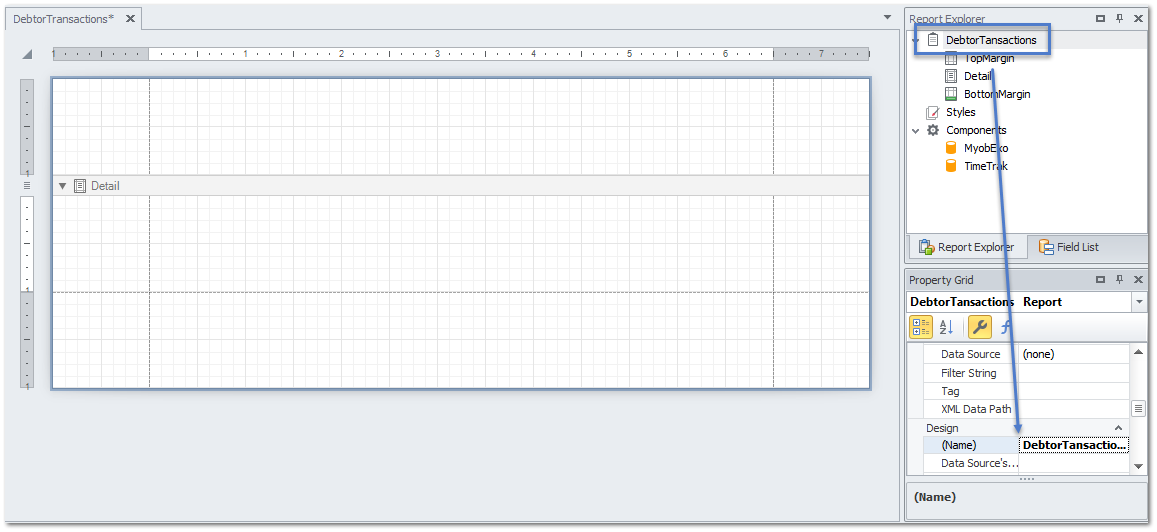
In the Report Explorer, click on the Report.
In the Properties Grid, update the Reports Display Name (Under Behaviour) and Name (Under Design)
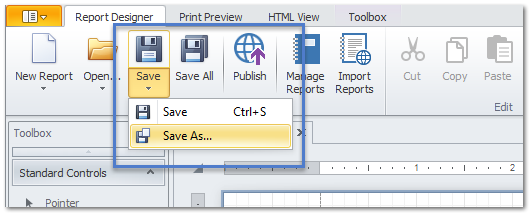
Click on Save – choose from the drop down option to Save As…
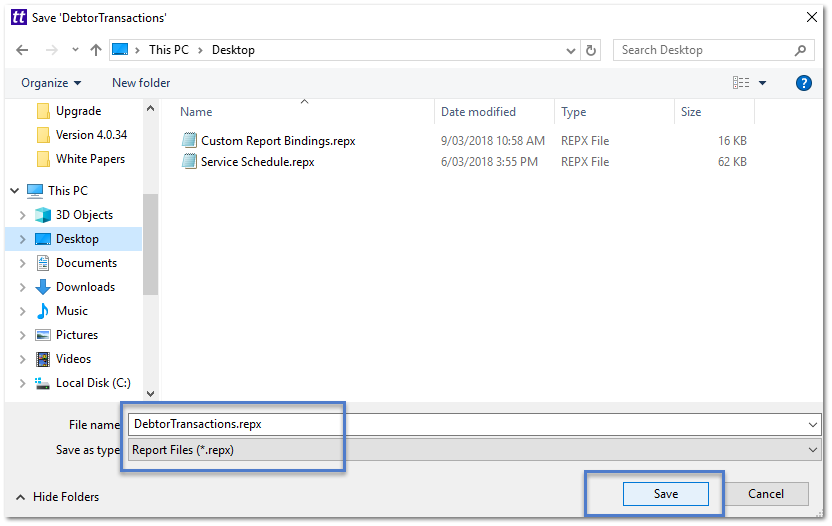
Save this either on the network or to a local drive.
Add data to the Report
Within the Report Explorer, right click on the Data Component that the data is coming from.
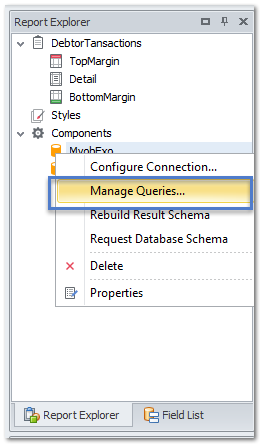
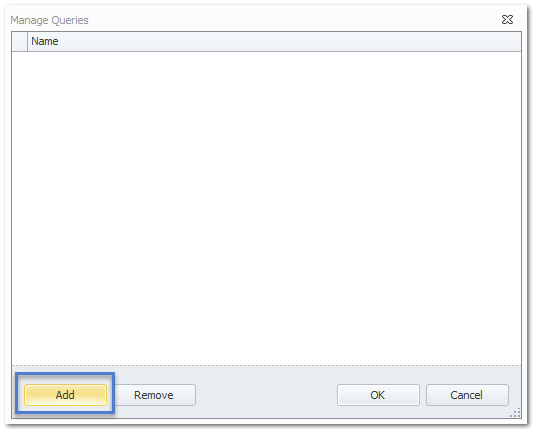
Click Add to add a new data query.
There can be any number of these to capture different information or the same information ordered differently in the Queries list.
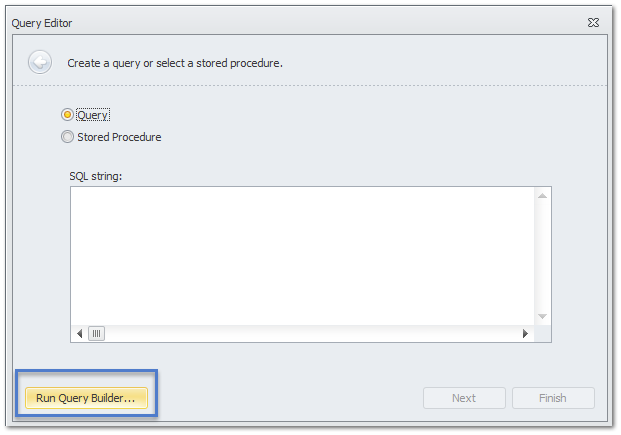
Within the Query Editor, you can run the Query Builder or enter in a stored procedure into the SQL String box.
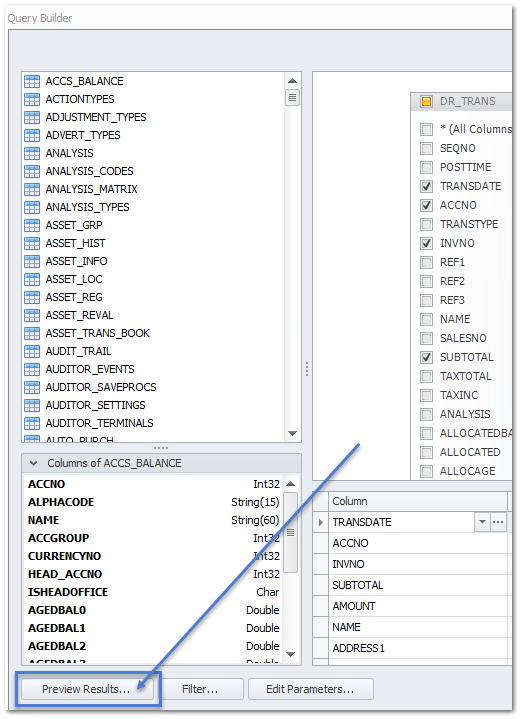
Within the Query Builder, you will see a list of the databases tables, and under that a list of the columns within that table.
Double click on a table to add it to the selection screen.
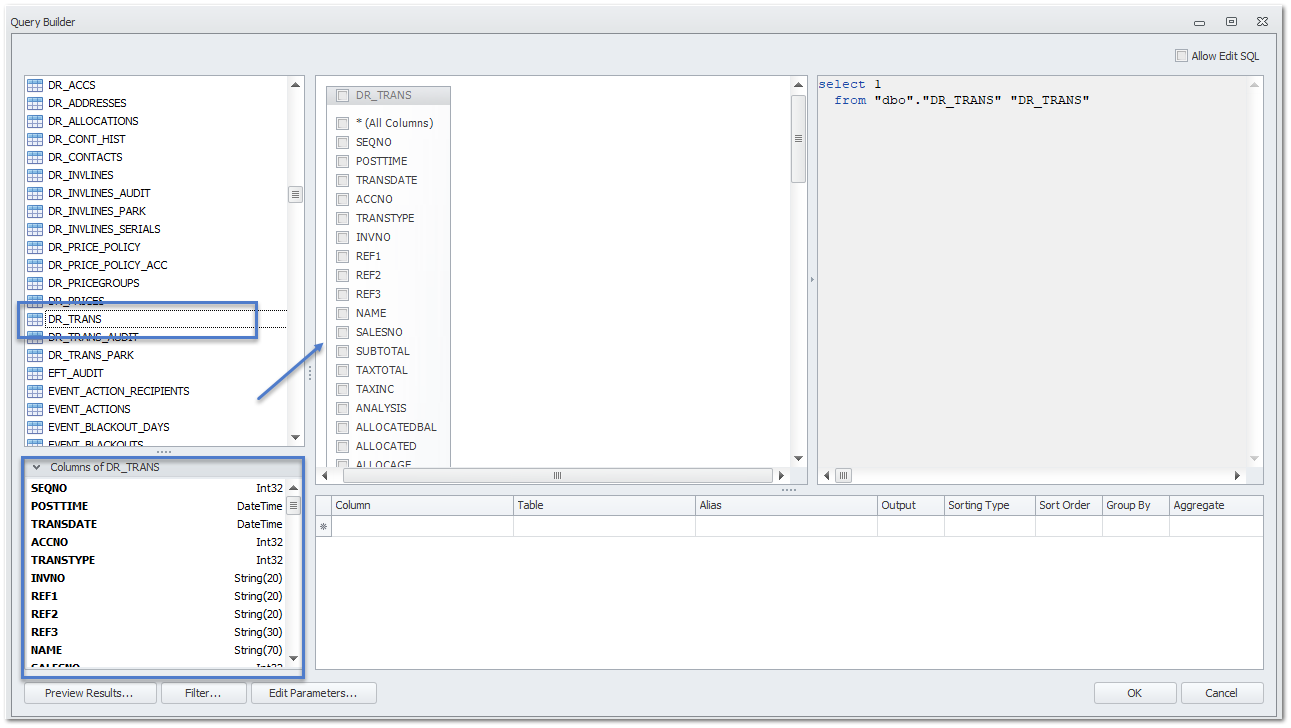
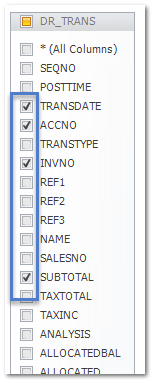
Select the fields that need to be visible on the report by clicking on the checkbox.
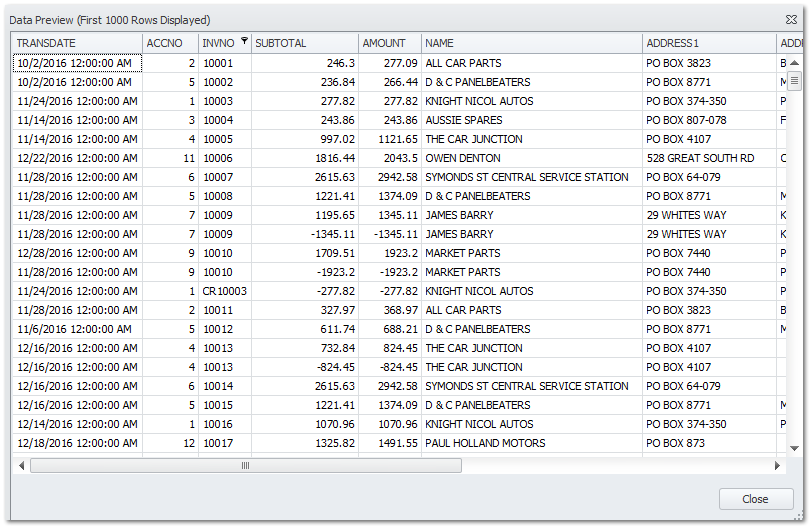
Click on Preview Results… to check the data that is pulled from the database.
To save the selected fields click OK.
Click Finish on the next screen.
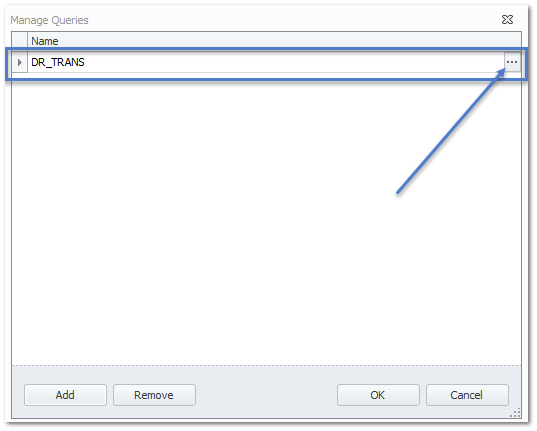
Then the Manage Queries screen will show the list of queries.
If the Query needs to be edited click on the queries … to open the above process.
Click OK once all the required data is entered.
Save the report.
Adding multiple tables into a Query
While in the Query Builder, add in more database tables by joins.
TimeTrak Report Writer allows two types of database joins.
INNER JOIN – This selects all rows from both tables as long as there is a match between the columns.
LEFT OUTER JOIN – returns all records from the left table (First Selected), even if there are no matches in the right table (Second Selected)
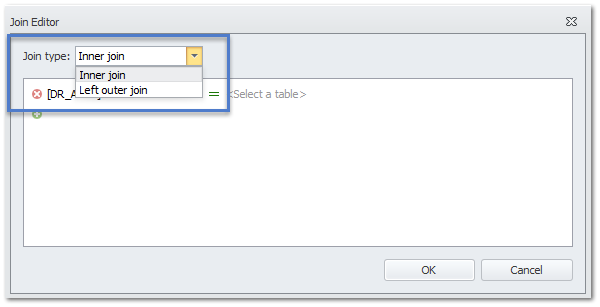
Choose the field from the second selected table that matches (one of) the first selected table(s).
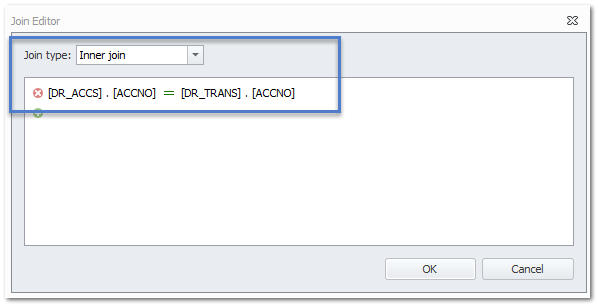
Click OK.
The tables will show in the display box with a link between them.
Double clicking on the link allows the user to edit it.
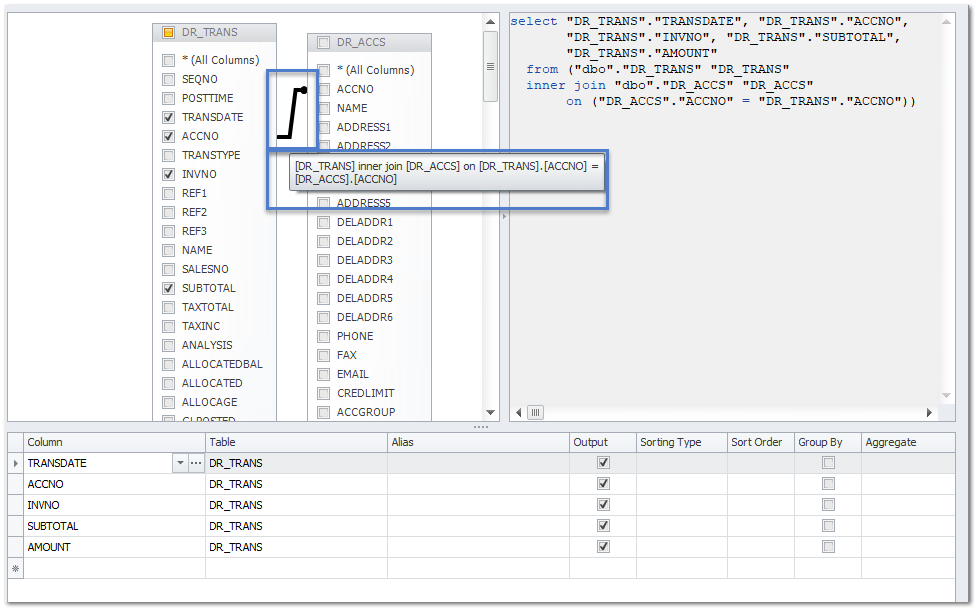
Tick on the checkbox of required fields from the new table.
Click on Preview Results… to check the data that is pulled from the database.


Add any number of required joins on the tables.
Add Fields to the Report
At the top left hand corner of the report is an expandable option where the default data query is selected.
The report will use this data and its main grouping information and data source by default.
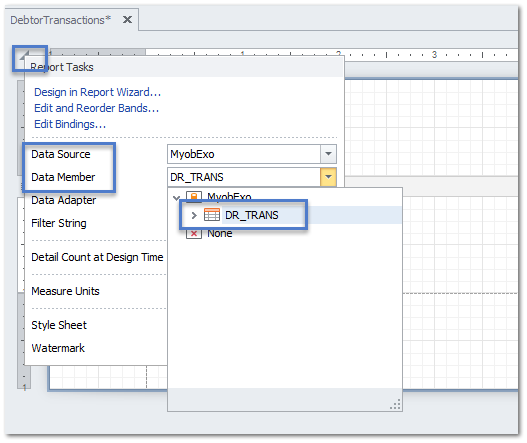
Click on the Field List.
Expand out the Query to see all of the selected fields.
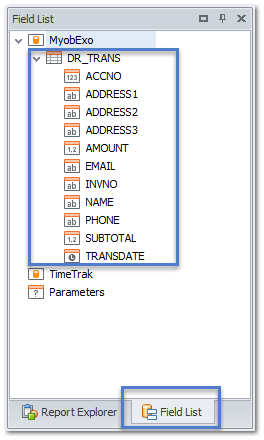
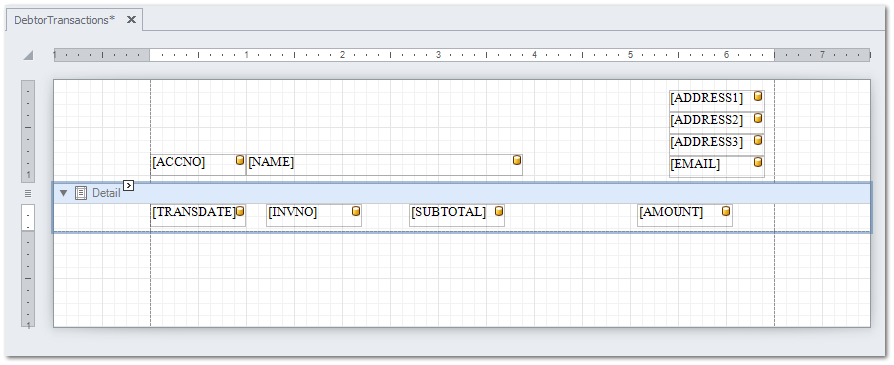
If all of the fields from the Query need to be in the report then drag and drop them from the Query Name onto the report.

Or drag and drop one field at a time onto the report.

Example of a populated report.
Tips
- Any white space on the report within the designer will add that white space on the report so make sure you keep the grouping and details panels close to the fields.
- The report is made up of Bands – by default, it shows the Top Margin, Detail and Bottom Band. Other bands can be added, if required.
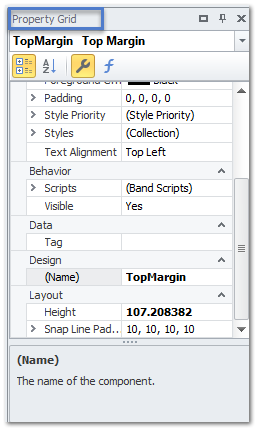
- Each band and item within the report has its own set of properties; it is in the Properties where the controls for Appearance, Behaviour, Data, Design and Layout can be set.
Save the report.
Add an Image
Before this process is started, make sure the image is the size it needs to be in the report for ease of adding.
From the Standard Controls menu, select a Picture Box.

Drag and drop it into the report where it is meant to be.
Resize it as required by dragging the edges of the box out (or in).
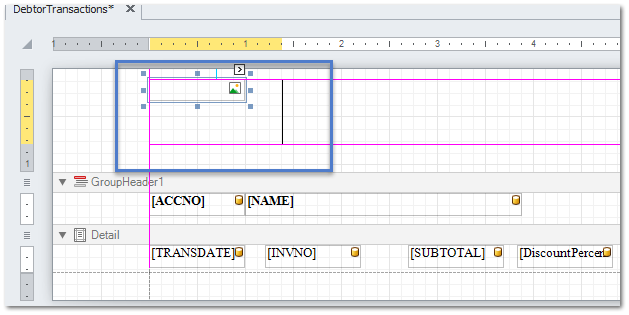
Click on the small arrow to see the image options.
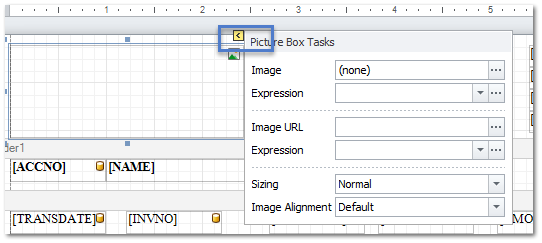
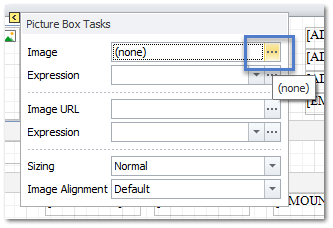
An image can be linked to an image saved locally by clicking on the … from the Image option.
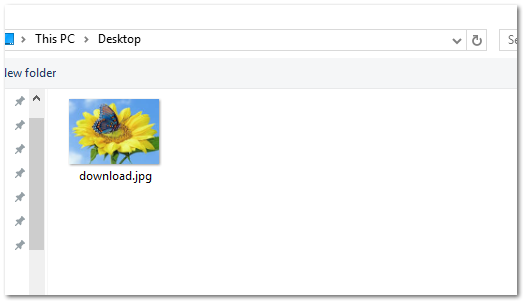
A Windows browser will open to find images.
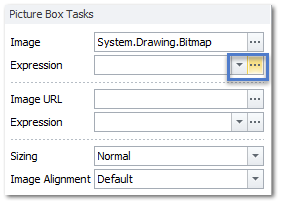
If the image is saved within the database then it can be referenced via the Expression.
Best Practice – is to reference to an already hosted image.
Enter in the URL to the Image Url field.
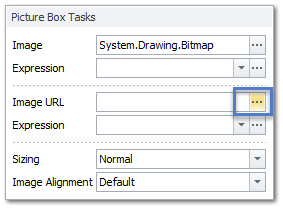
Then set the sizing of the image, the options are:
- Normal -The image is displayed with its original dimensions.
- Stretch Image -The image is stretched to fill both the control’s width and height.
- Auto-Size -The control’s dimensions are auto-adjusted to the image size.
- Zoom Image -The image is proportionally resized, so that it fits the control.
- Squeeze – If the control’s dimensions exceed the image size, the image is centered and shown full-size. Otherwise, the image is resized to fit into the control’s dimensions.
- Tile – The original image is replicated within the picture control starting from the upper-left corner. The replicated image is clipped if it does not fit in the picture control which contains it.
Preview Results
Throughout the creation of a report it is good practice to preview the results.
There are two option to view how it will look:
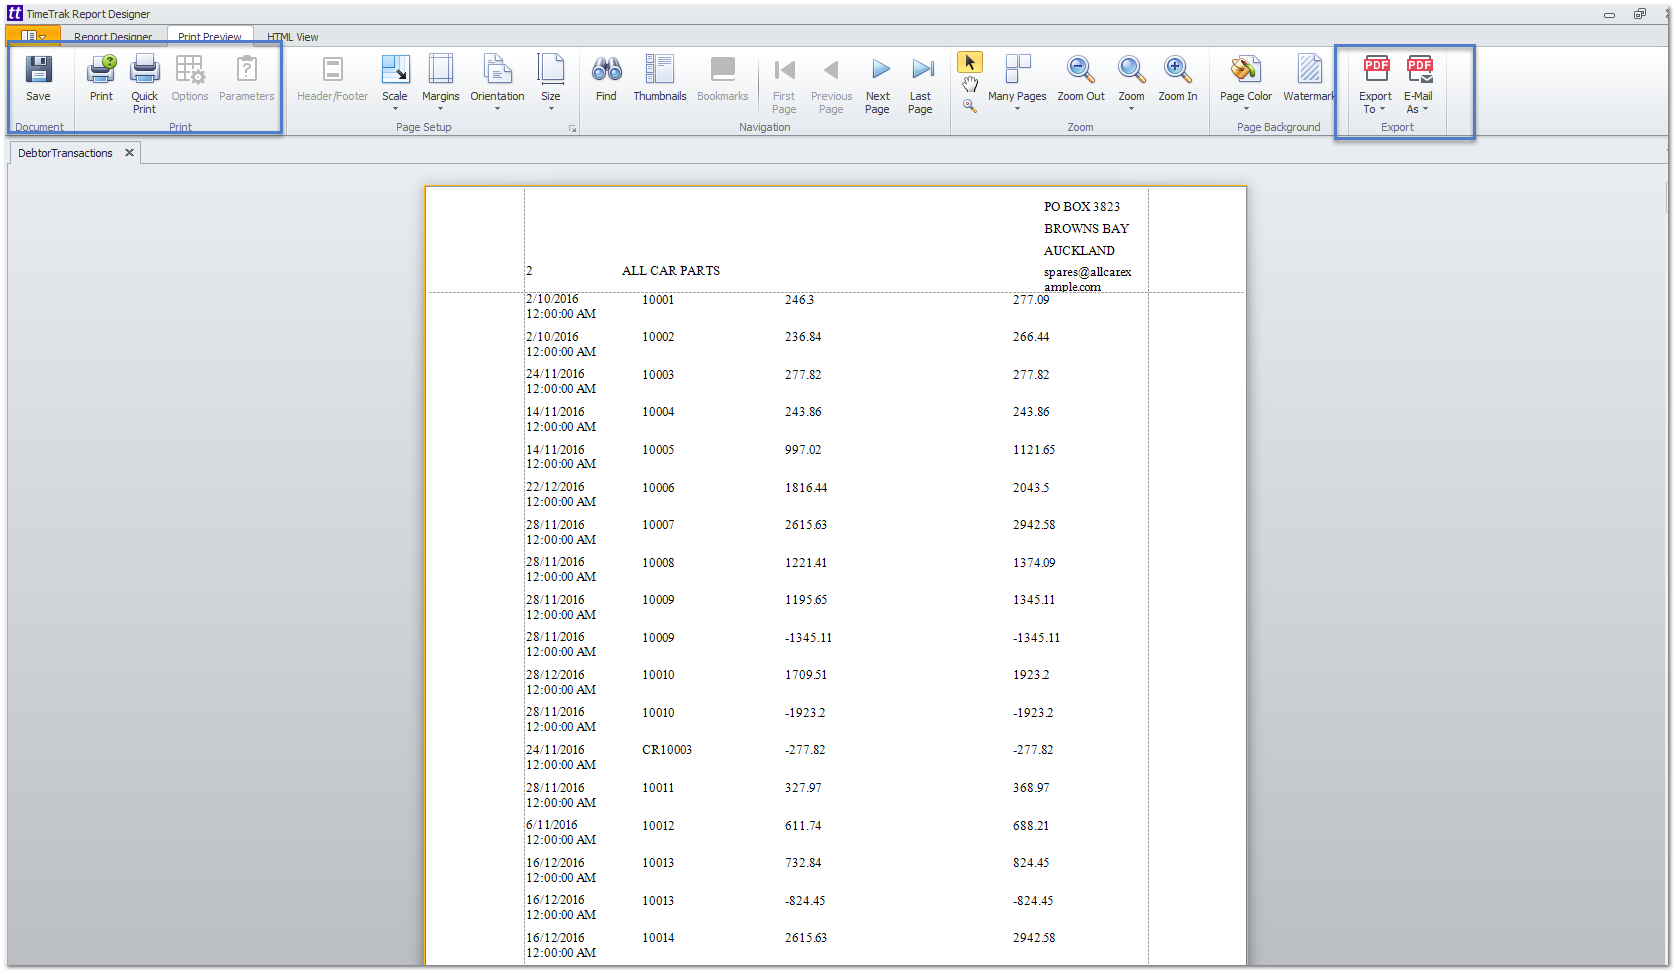
- Print Preview – shows how the report will look when printed or exported
- HTML Preview – shows how the report will look in the web page
At the top of the Report Designer, there are the two tabs that allows the preview to run.

Within the Print Preview is some options on exporting or saving the file so the final output can be tested.
Save the report.
Parameters
A report might need to be filtered before it is run, to do this set up some parameters.
These are visible when the report is first run and the data within the report is filtered by what the user selects.
Within the Report Designer > Go to Field List Tab > Parameters
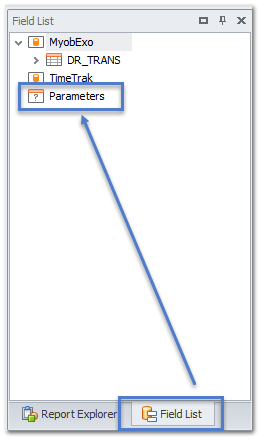
Right click on the Parameter field and select Add Parameter.
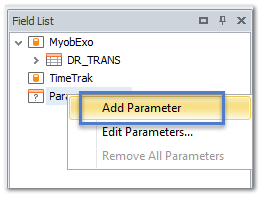
The Add New Parameter screen will pop up.
Give the Parameter a:
- Name (No Spaces)
- Description
- Select a Type
Optional:
The tick boxes:
- Show in Parameters Panel – this can mean the parameter is hidden on the report – in TimeTrak we can pass though some set fields from within the website to the report if the parameters are named the same. These are: (case sensitive)
- TaskId
- ServiceableUnitId
- PurchaseOrderId
- OpportunityId
- JobId
- InvoiceId
- ClientId
- ResultId (Checklist results)
- Supports the collection of standard values – this will allow the user to reference database data as a parameter or set static values like a list.
- Allow multiple values – if this is selected then make sure when you add the parameters to the Queries you allow for the ability to filter by more than one result.
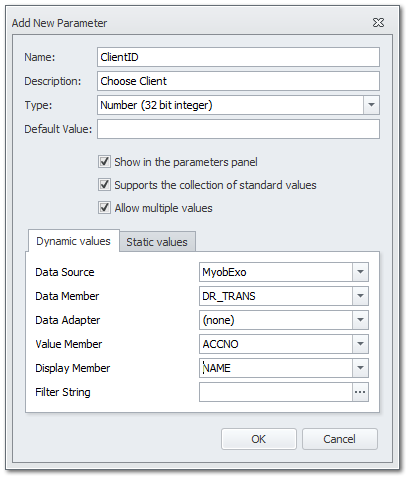
Example of parameters setup
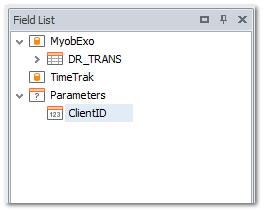
Once the parameters are set up then they need to be applied to the data queries.
- Report Explorer Tab
- Right click on data source
- Manage Queries
- Open the data query that is to be filtered by the parameter
- Click on the Run Query Builder button
- Click on the Filter Button
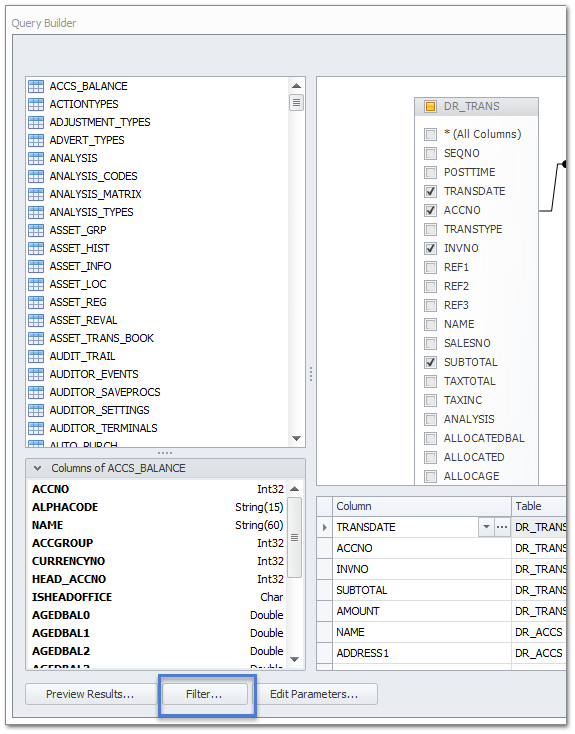
Next to the And click on the plus icon
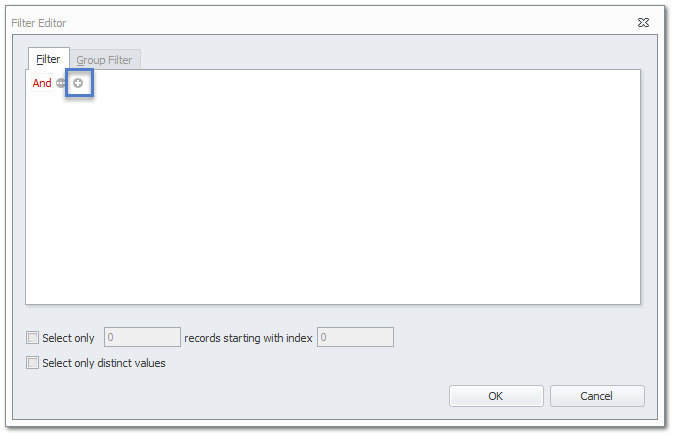
Select which data field is going to have the parameter applied against it – usually the same field.
Choose the filter criteria.
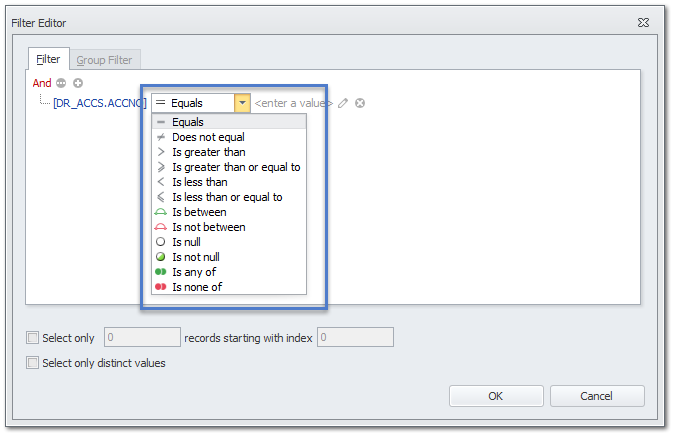
To match this to the parameter, click on the pen icon until it changes to the parameter icon.
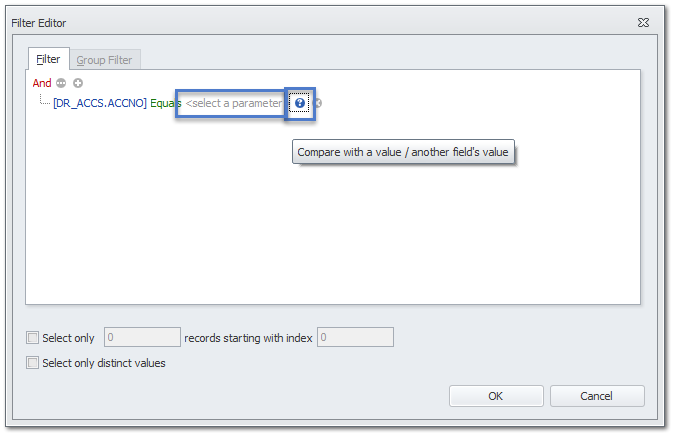
Then bind the parameter to the filter.
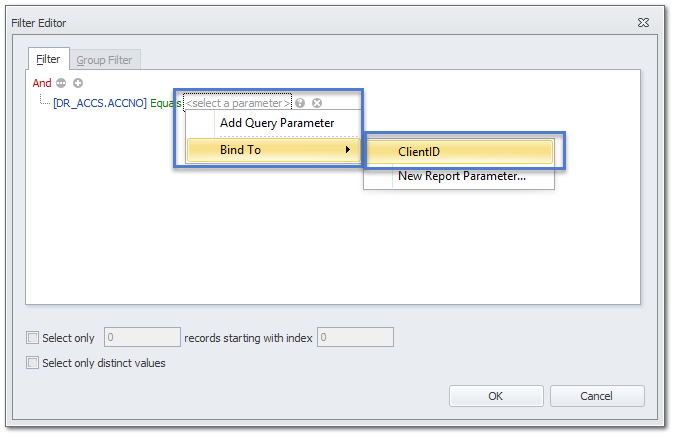
Click OK, OK, Next, Finish to save the Query with the Filter by parameter applied.
When previewing the report it will now show the parameter (if visible) on the side of the report.
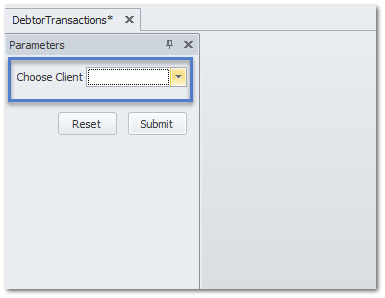
Save the report.
Bands and Grouping
A report can have its data organised into bands and groups.
Right click on the Detail Band to see the options.
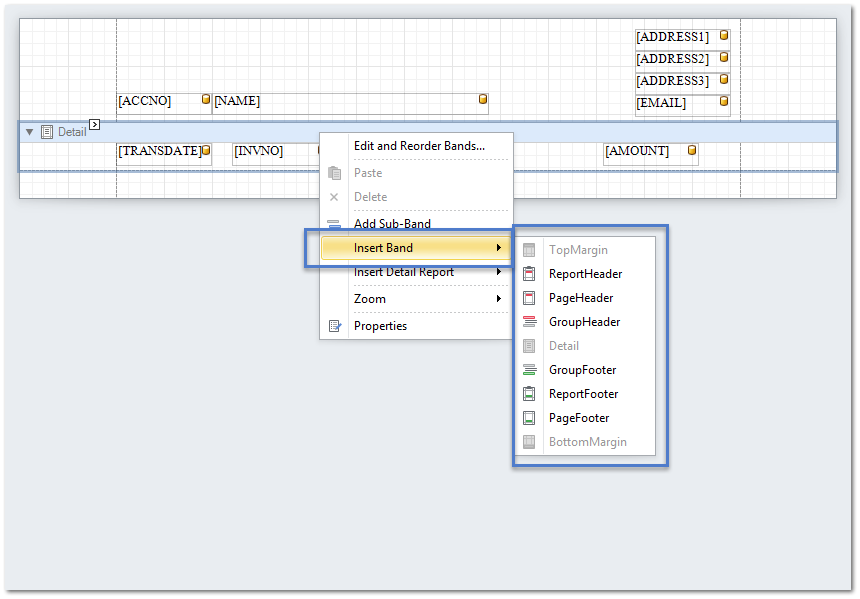
More information about Bands – DevExpress website
The bands work like this:
- Top Margin – sits at the top of the report and often does not have any data inserted in it, if it does it is only displayed once in the report.
- Report Header – also sits at the top of the report but it can be set to show on each new page of the report or just on the first page.
- Group Header – this will group data within the detail of the Group, it usually contains a label with the data the details are grouped by.
- Detail – this is where the bulk of the data records will be displayed.
- Group Footer – this is the end of the grouped data and is often used to show summary information based on the grouped data.
- Page Footer – this is at the bottom of the report and shows usually on the last page of the report.
- Bottom Margin – sits at the bottom of the report and often does not have any data inserted in it, if it does it is only displayed once in the report.
Set up a Group to group by a data field add the Group to the Report.
Click on the small arrow icon to expand options.
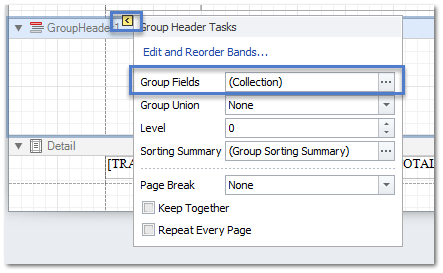
Click on … for the Group Fields to add in the data field.
Click Add.
Choose the data field and the order it is to be grouped by.
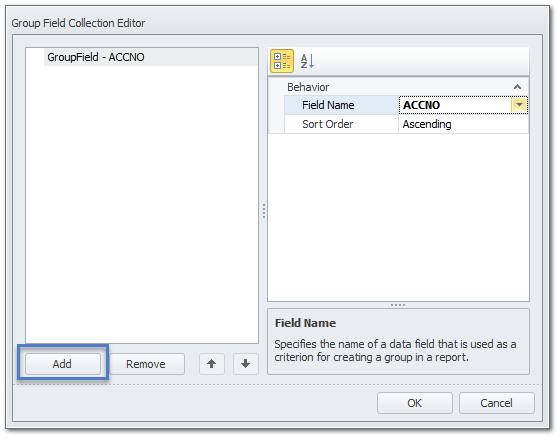
Click OK.
Move data fields into the Group Header to show what information is grouped by.
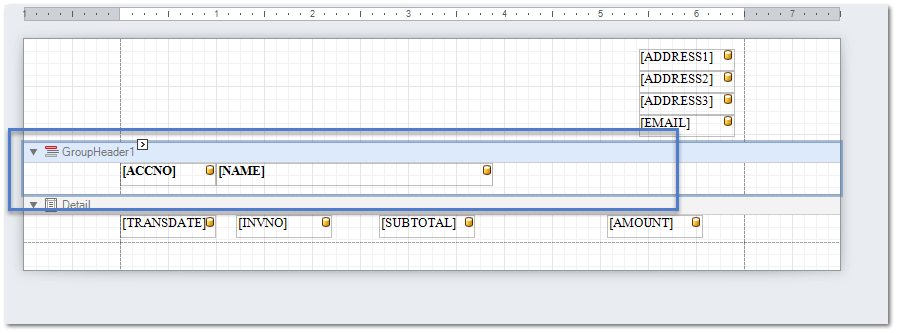
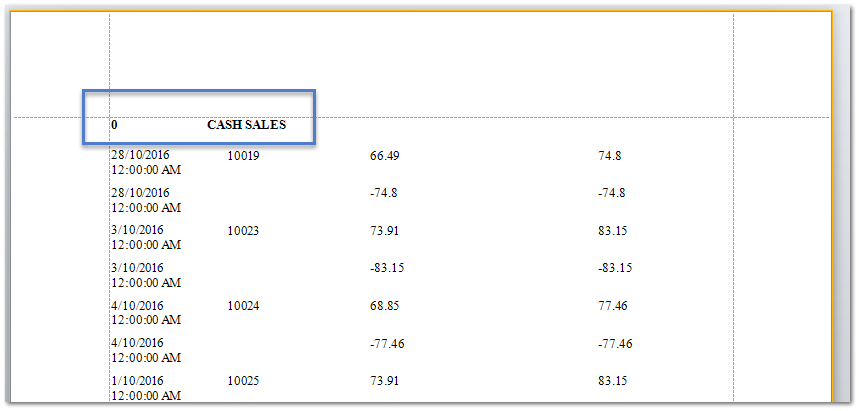
The Print or HTML Preview will now show the data in the group that was set.
Save the report.
Formatting
A TimeTrak Report can be formatted to suit the organisation’s needs.
The report writer comes with WYSIWYG (What you see is what you get) formatting built in and found along the top of the Report Writer Screen.

Any settings set here will flow over all of the content within the Report.
Each Control added to the report can have its own formatting though.
Users can use the above formatting tool to edit a selected Control or they can go into the Properties of the Control and set the Appearance.
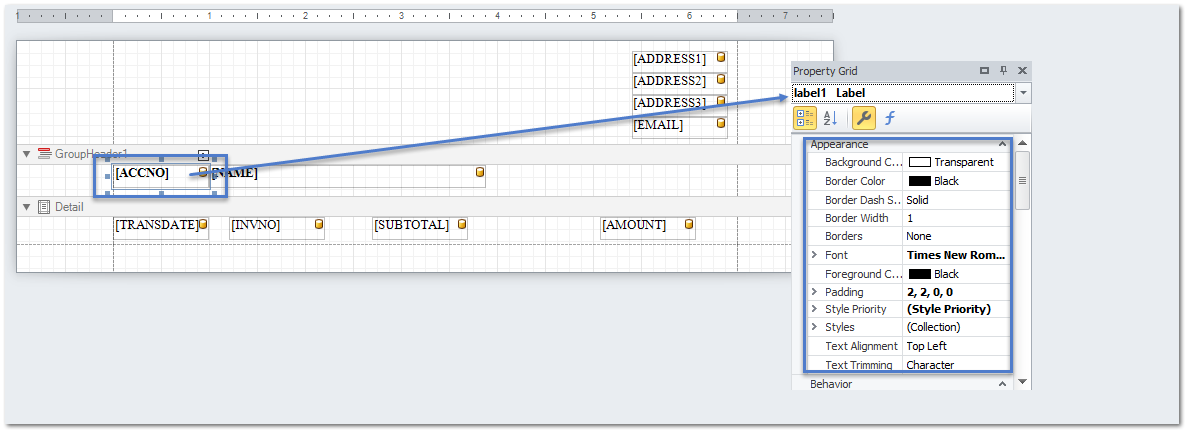
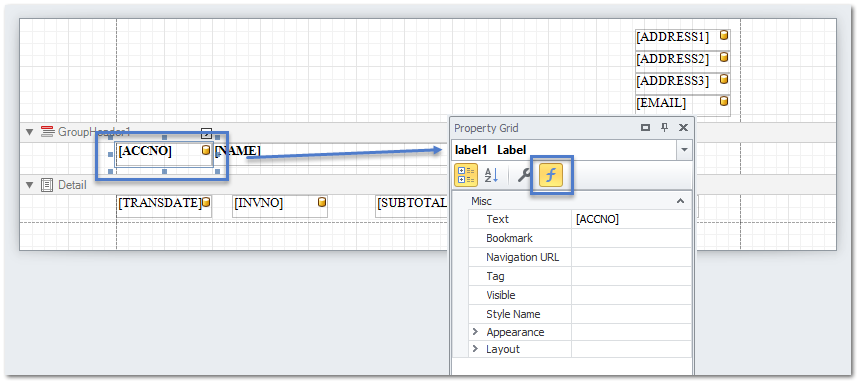
To enter in dynamic formatting then use Expressions against the control (s) (More Advanced Users only)
For more information on Expressions look at the DevExpress Website
Click on the Control > Go to the Properties Grid > Click on the Formatting Icon
In the Formatting Option click on the …
Add in the expression to filter the data by into the Expression Editor
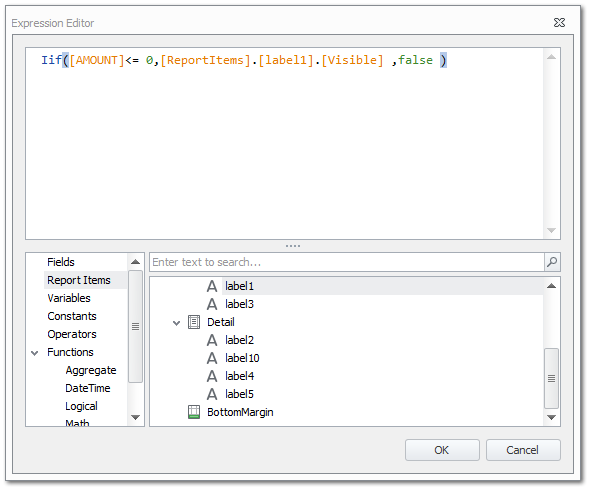
Click OK
Save the report.
Calculated Fields
A report can have a calculated field added to it via an already created query.
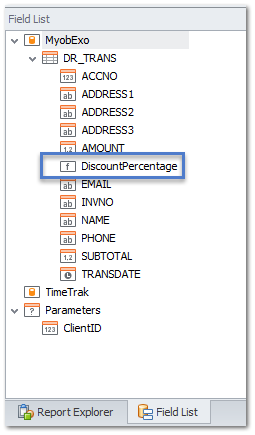
In the Fields List, right click on the Query’s name.
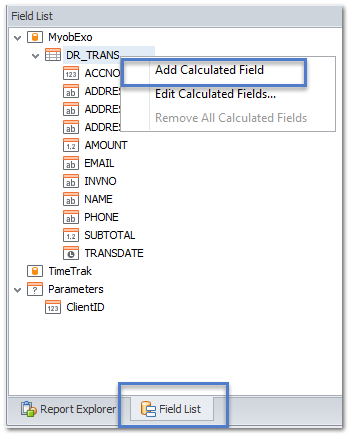
A new Calculated field will show in the fields.
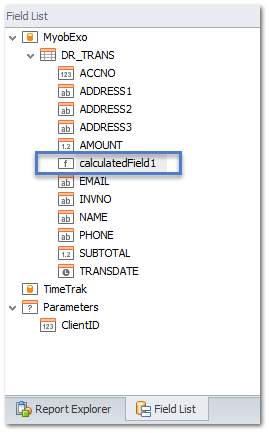
Right click on the Calculated field and choose Edit Calculated Field.
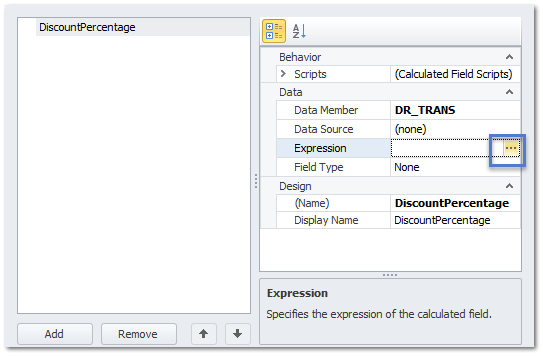
Update the Field Name.
Within the Expression field click on the …
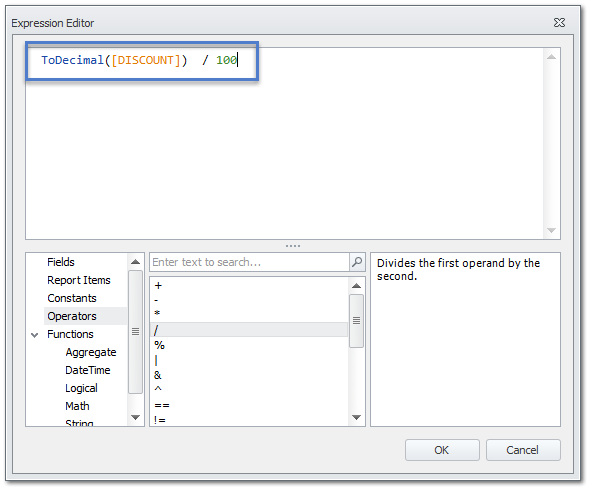
Add in the expression in the Editor.
The Calculated Field is now a field that can be added to the report.
Save the report.
Publishing the Report
Once the Report is completed and ready to be visible on the TimeTrak websites then you can publish it.
Click on the Publish Icon.
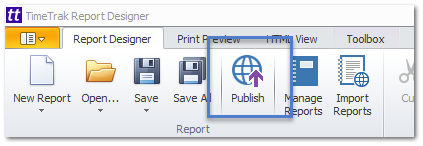
The Publish Report pop up will show.
If this is a brand new report you can set:
- Name – Give the Report a meaningful name
- Category – Administrator is only visible to Global Administrators, TaskTrak shows with the other Task Reports and General is for all other reports.
- Report Type – More than one can be selected
- General – This is a General Report and displays in the Reports menu
- Client – The report will show on the reports tab of the Client Screen
- Job – The report will show on the reports tab of the Job Screen
- Quote – The report will show as a report in TimeTrak Mobile when Quoting on the Job
- Invoice – The report will show as a report in TimeTrak Mobile when Invoicing on the Job
- Purchase order -The report will show as a report in TimeTrak Mobile when Ordering on the Job
- Serviceable Unit – The report will show as a report in the Serviceable Unit Screen
- Checklist – This is a Checklist Report and is assigned to a Checklist and fired off when the Checklist is completed
- Task – The report will show in the list with other Task Reports
- Opportunity Quote – The report will show as a report in TimeTrak Mobile when Quoting on the Opportunity
- Permissions – select a Profile
- Visibility – Choose which website or websites the report is visible in.
Click OK.
Alternatively, you can overwrite an existing customised report by choosing to Update Existing Report and it will write your latest copy over the existing report.